PEPE Price Prediction: Analyzing the Path to $0.00002583

#PEPE
- PEPE trades above its 20-day moving average, indicating potential bullish momentum
- Technical patterns suggest targets of $0.00001150 by September 30 and $0.00002583 longer-term
- Mixed signals between recent price decline and underlying technical strength create strategic entry opportunities
PEPE Price Prediction
Technical Analysis: PEPE Shows Bullish Momentum Above Key Moving Average
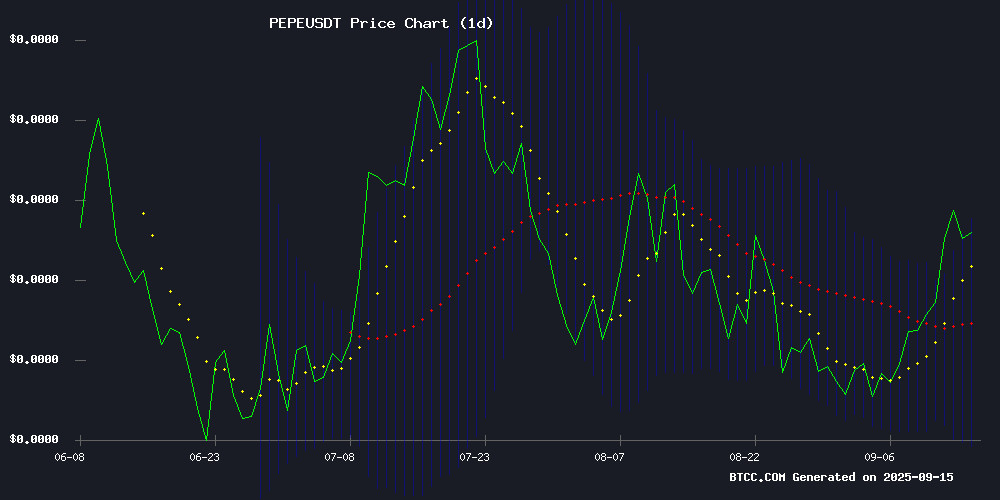
PEPE is currently trading at $0.00001071, positioned above its 20-day moving average of $0.00001024, indicating underlying bullish momentum. The MACD reading of -0.00000049 with a signal line at 0.00000002 suggests weakening bearish pressure, though the negative histogram of -0.00000051 indicates some near-term consolidation. Bollinger Bands show price action between the upper band at $0.00001164 and lower band at $0.00000885, with the middle band aligning with the 20-day MA. According to BTCC financial analyst Sophia, 'The positioning above the moving average combined with the MACD configuration suggests potential for upward movement, though traders should monitor the $0.00001024 level as key support.'
Market Sentiment: Mixed Signals Amid Technical Breakout Potential
Current market sentiment for Pepe reflects a dichotomy between technical bullish signals and recent price performance. Despite a 5.83% price drop, technical analysis points toward potential recovery, with predictions targeting $0.00001150 by September 30 and a longer-term symmetrical wedge pattern suggesting a rally toward $0.00002583. BTCC financial analyst Sophia notes, 'The discrepancy between recent price action and technical indicators creates an interesting dynamic. While short-term volatility persists, the underlying technical structure supports the possibility of a 15% rally as RSI recovery signals gain traction.' This aligns with the technical perspective that current levels may present accumulation opportunities for patient investors.
Factors Influencing PEPE's Price
PEPE Symmetrical Wedge Pattern Signals Rally Toward $0.00002583 Target
PEPE faces bearish pressure with an 8.19% drop in 24 hours, reflecting broader market weakness. Despite this, weekly gains remain positive at 5.75%, indicating mixed sentiment among traders.
The token trades at $0.00001077, with a 24-hour volume down 28.46% to $958.31 million. Market capitalization has slipped 8.26% to $4.53 billion, yet analysts see potential for a sharp reversal if bullish conditions emerge.
A symmetrical wedge pattern has formed since early 2025, with price oscillating between resistance at $0.00001476 and support near $0.00000800. The current test of the upper boundary at $0.00001127 suggests breakout potential toward $0.00002583.
Derivatives activity shows cautious bullish positioning, underscoring the market's divided outlook. Traders await confirmation of either a decisive breakout or rejection at current levels.
PEPE Price Drops 5.83% Despite Bullish Technical Signals
PEPE's price fell 5.83% in the past 24 hours, contrasting with bullish MACD momentum and a neutral RSI at 52.23. The decline reflects broader market sentiment rather than specific catalysts, with Binance spot volumes remaining robust at $163 million.
Technical analysis suggests profit-taking and sector rotation are driving the meme coin's volatility. Traders appear to be positioning for potential breakouts, leveraging mixed signals as a tactical opportunity.
PEPE Price Prediction: Targeting $0.00001150 by September 30 as RSI Recovery Signals Potential 15% Rally
PEPE, the meme coin, shows signs of a potential reversal despite a recent 6.86% decline. Technical indicators suggest a 15% rally to $0.00001150 in the short term, with medium-term targets ranging between $0.000014 and $0.0000175 by Q3 2025.
Analysts from CoinDCX highlight cautious optimism, citing recovering momentum indicators and sustained community engagement as key drivers. The $0.00001050 resistance and $0.00000980 support levels remain critical for PEPE's next directional move.
Meme coins continue to demonstrate resilience, with PEPE positioned for significant upside if retail participation increases through potential exchange listings.
Is PEPE a good investment?
Based on current technical indicators and market sentiment, PEPE presents a compelling case for strategic investment consideration. The cryptocurrency trades above its 20-day moving average while showing signs of MACD convergence, suggesting weakening bearish momentum. Technical patterns indicate potential targets of $0.00001150 by month-end and $0.00002583 in the longer term.
| Indicator | Current Value | Signal |
|---|---|---|
| Current Price | $0.00001071 | Neutral/Bullish |
| 20-day MA | $0.00001024 | Support Level |
| MACD Histogram | -0.00000051 | Converging |
| Bollinger Upper | $0.00001164 | Resistance |
| Bollinger Lower | $0.00000885 | Support |
As BTCC financial analyst Sophia emphasizes, 'The combination of technical positioning and fundamental pattern recognition suggests PEPE could reward investors who can withstand near-term volatility. However, appropriate position sizing and risk management remain essential given cryptocurrency market dynamics.'
